PREDICTIONS
What are predictions?
Predictions in Upshot.ai are used to predict churn and conversion of a particular segment of users for a stipulated period of time performing/not performing selected events as per the prediction rule.
Churn prediction is one of the most popular use cases in business. Let’s consider a business that sells monthly subscriptions( Netflix, Hotstar, Amazon Prime etc..).Three possible ways that these companies make more revenue : acquire more customers, Upselling existing customers or increase customer retention. But how to retain most of the user base before they are actually gone? This is where prediction comes in handy.
Churn prediction helps us to predict which customers are likely to cancel the subscription to the service based on how they were using the service. In general, we want to predict the answer for the following question for each individual customer : “Is this customer going to leave us in the next X Days/Months?”
Conversion prediction is similar to Churn prediction but it seeks answer to a different question:”Is this customer going to convert in the next Days/Months?”.
Based on the output one can create more focused retention/conversion strategies with incentives to strengthen the relationship with the customer who is about to churn/convert respectively.
How to configure the prediction rule?
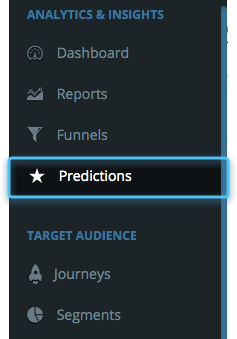
You can create or access the prediction rule on Upshot.ai dashboard in the Analytics & Insights section.
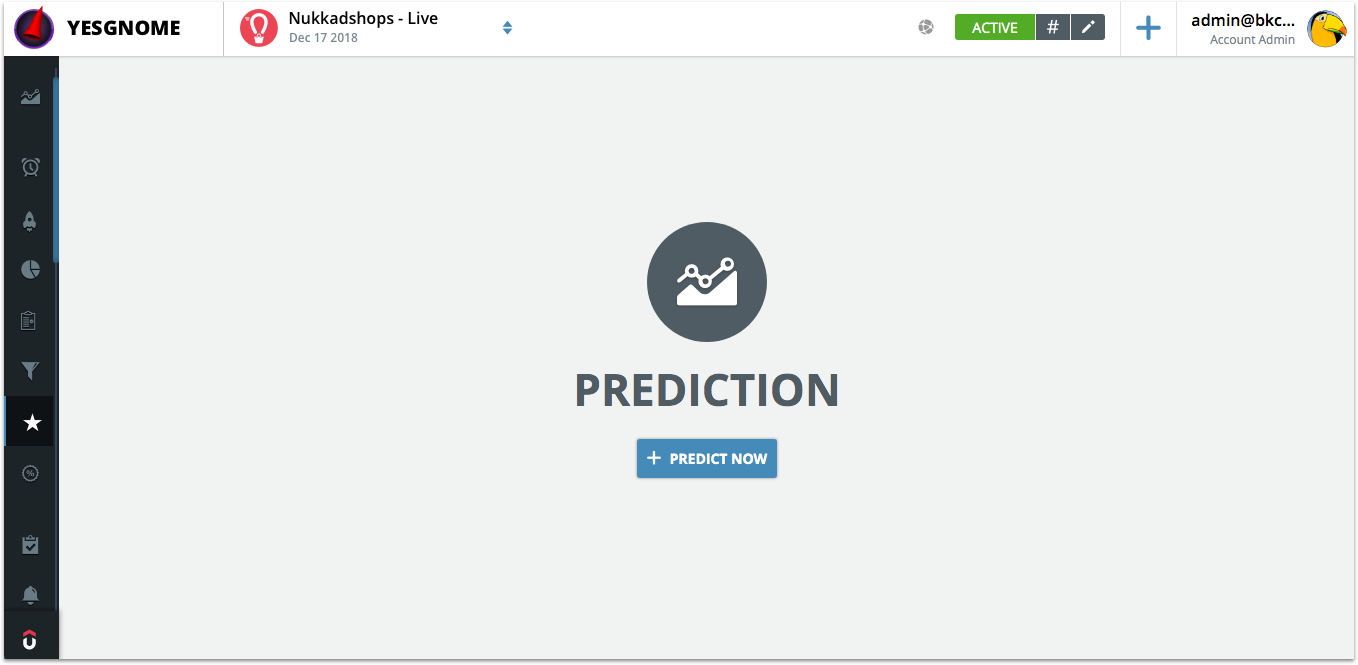
To create a new prediction , click on “Predict” button on the top right corner.
The prediction rule has 4 components as shown in the screenshot below
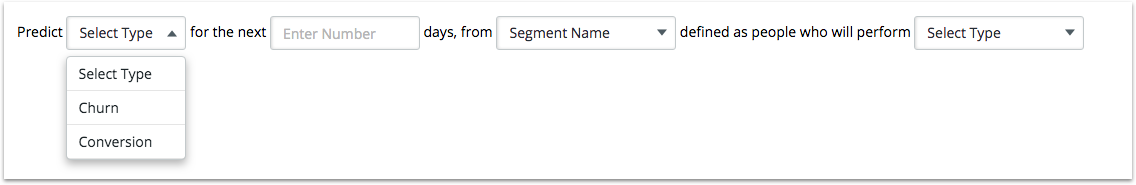
-
Prediction Rule Components
Type of Prediction : Churn or Conversion.
Churn : Churn is defined as “an activity NOT being performed” by a user.
Conversion: Conversion is the act of “performing an action”.
All users who DO NOT perform the selected events are deemed to be “churned” users. Whereas all users who HAVE performed the selected events are deemed to be “converted” users.
X Days - The number of days for which the given segment users are monitored to arrive at the prediction. Example, if you would want to identify the users who might churn in the coming 30 days, this number would be “30”. Upshot monitors all activity of every user in the selected segment and derive patterns from that activity that caused a churn earlier and identifies users who fit the same pattern and might churn in the next 30 days.
Segment Name : The target group on which the prediction is to be run.
Events: The events which MUST have or not have happened for a user to convert or churn respectively.
A maximum of 50 events can be selected and grouped with an OR or AND evaluation criteria.
Example 1: If your definition of conversion is “all people who have performed ANY of the events A and B”, then you would select those events with an OR clause.
Example 2: If your definition of conversion is “all people who have performed ALL of the events A and B”, then you would select those events with an AND clause.
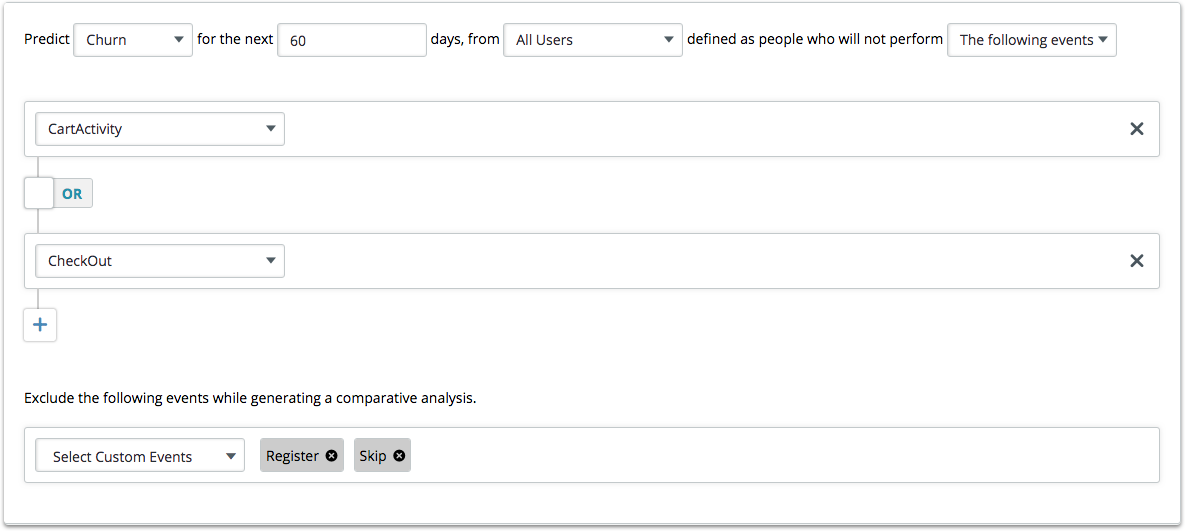
As the prediction algorithm considers list of ALL events performed by all users previously, for better comparative analysis we can exclude events which have no bearing on the predictions. Example: A screen view or simply launching the app, going to help screen, or other events which are performed daily (and could occur a lot of times). This will increase the accuracy of prediction by limiting “junk” / irrelevant events.
How to analyse the prediction report?
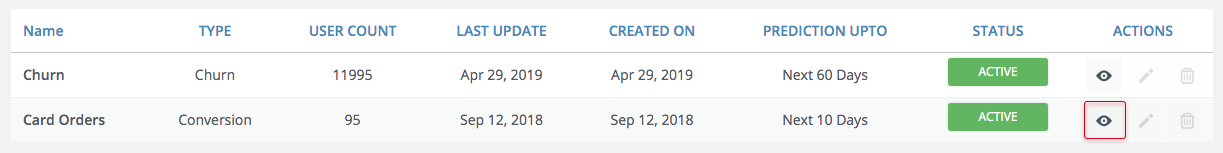
Once the prediction is active we can access the prediction report by clicking on the “eye” icon next to the active status of the prediction.
To view the prediction report. Click on the eye icon.
The report consists of all necessary details listed as below:
Prediction type
Segment Name
Prediction criteria (i.e., Prediction rule)
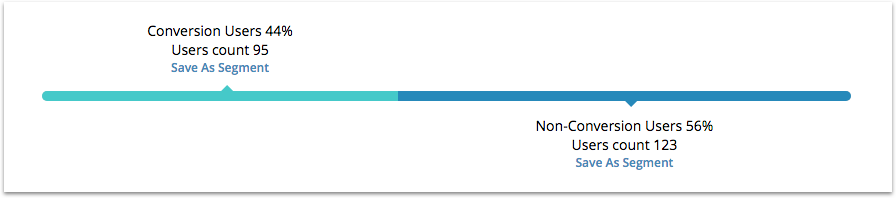
Conversion users percentage ( There is an option to segment these users , which can be further used to run targeted campaigns)
Non Conversion users percentage ( Option to segment these users as well).
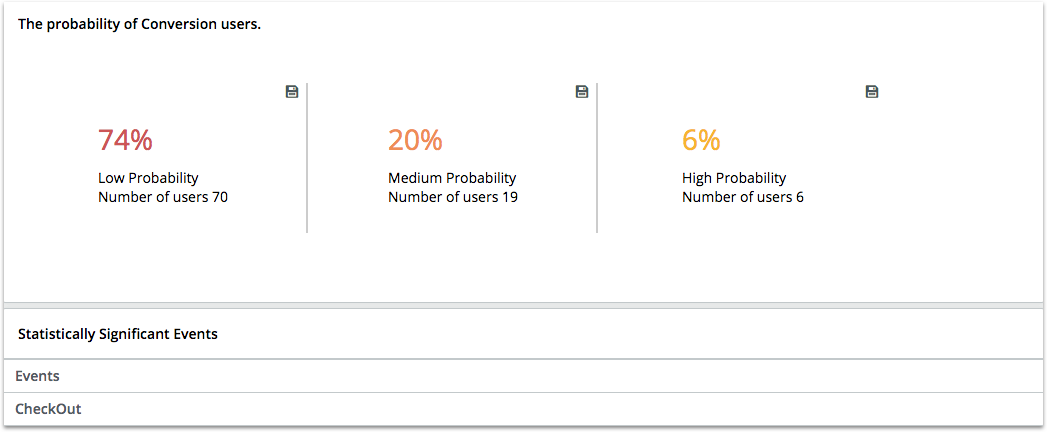
As per the rule defined and user usage the algorithm predicts the percentage of users who might convert in the next X days. But the probability of conversion differs from user to user.
Thus the probability of conversion is divided into 3 categories:
Low probability : Users who are less inclined towards conversion
Medium probability : Users who are mediumly inclined towards conversion
High probability : Users who are highly inclined towards conversion.
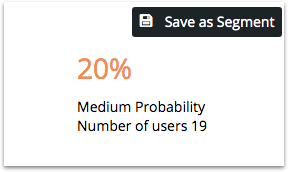
Each one of these categorical users can be saved as a segment and targeted to convert the low and medium probability users into high probability users.
Statistically significant events are nothing but important events upon which the prediction was calculated.The higher the significance of the event, the higher the chances of reliability and accuracy in the outcomes.The events should be independent of any other events or at least less dependent on other events. For example user performs “view store” event for various purposes like window shopping , Price checking etc. We can’t attribute the spike in the particular event analytics to a particular reason as there are many reasons.
However the “CheckOut” event which is a conversion event is more reliable event as users checkout only if they are really interested to buy something. Predicting such statistically significant events which are less dependent on any other events will increase the prediction probability as well as prediction accuracy.