DASHBOARD
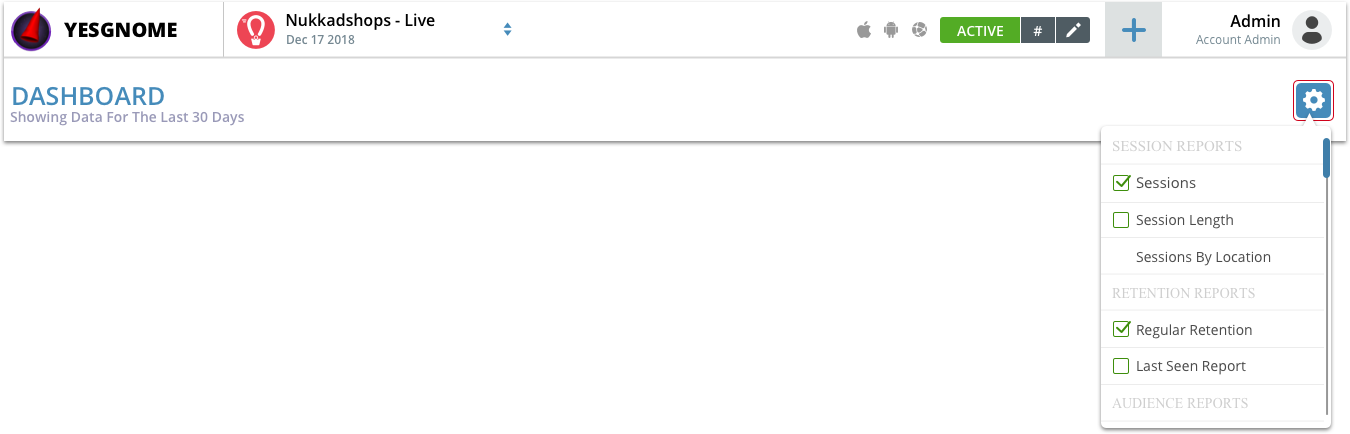
This will be the default landing screen of Upshot.ai Dashboard. Upshot.ai provides 30 reports by default processed and displayed in the reports section. You will be able to choose the reports that matter to you and add them to the Dashboard ( A maximum of 9 reports can be added).You will also have the ability to add any custom reports that you have created to the dashboard.
Any report added to the dashboard will display the last 30 days data.
HOW TO READ THE DATA
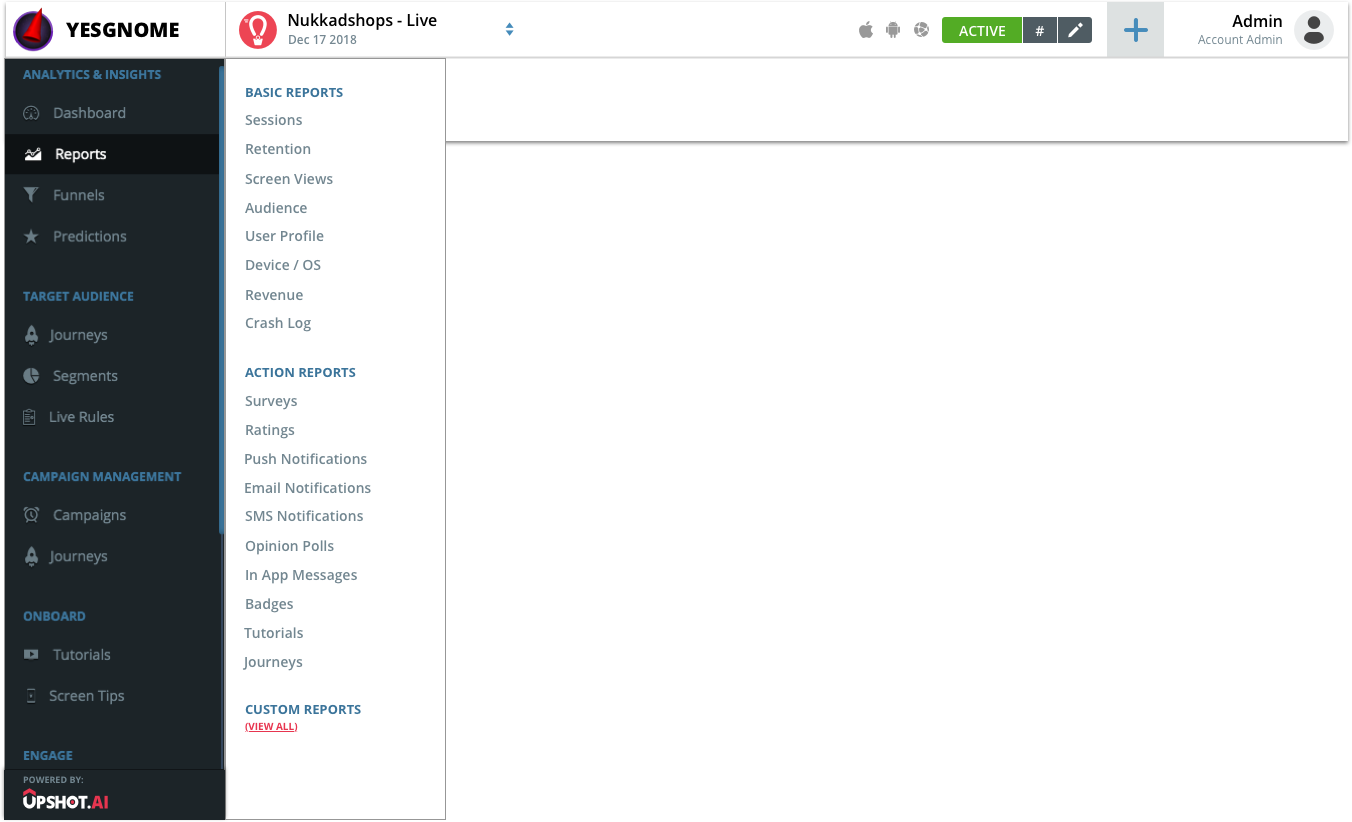
You will be able to access the reports section when you hover your mouse on the left hand panel. When you tap on the reports section a sub panel appears with reports categorized into three sections:
Basic Reports
Action Reports
Custom Reports
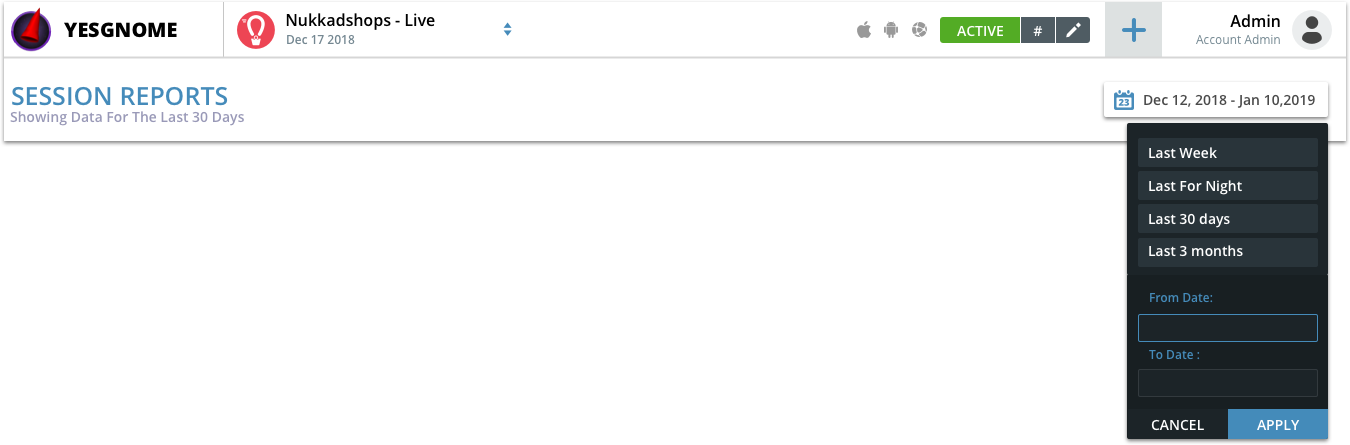
Date Picker
The date filter section allows you to choose the time period within which you wanted to access the data.
If the date range exceeds 30 days automatically the graph displays data in week view
If the date range exceeds 90 days automatically the graphs displays data in month view
Upshot supports viewing of 6 months data which means the difference between the from and to date selection cannot be more than 6 months and you can go back in time by a maximum of 2 years from the current date.
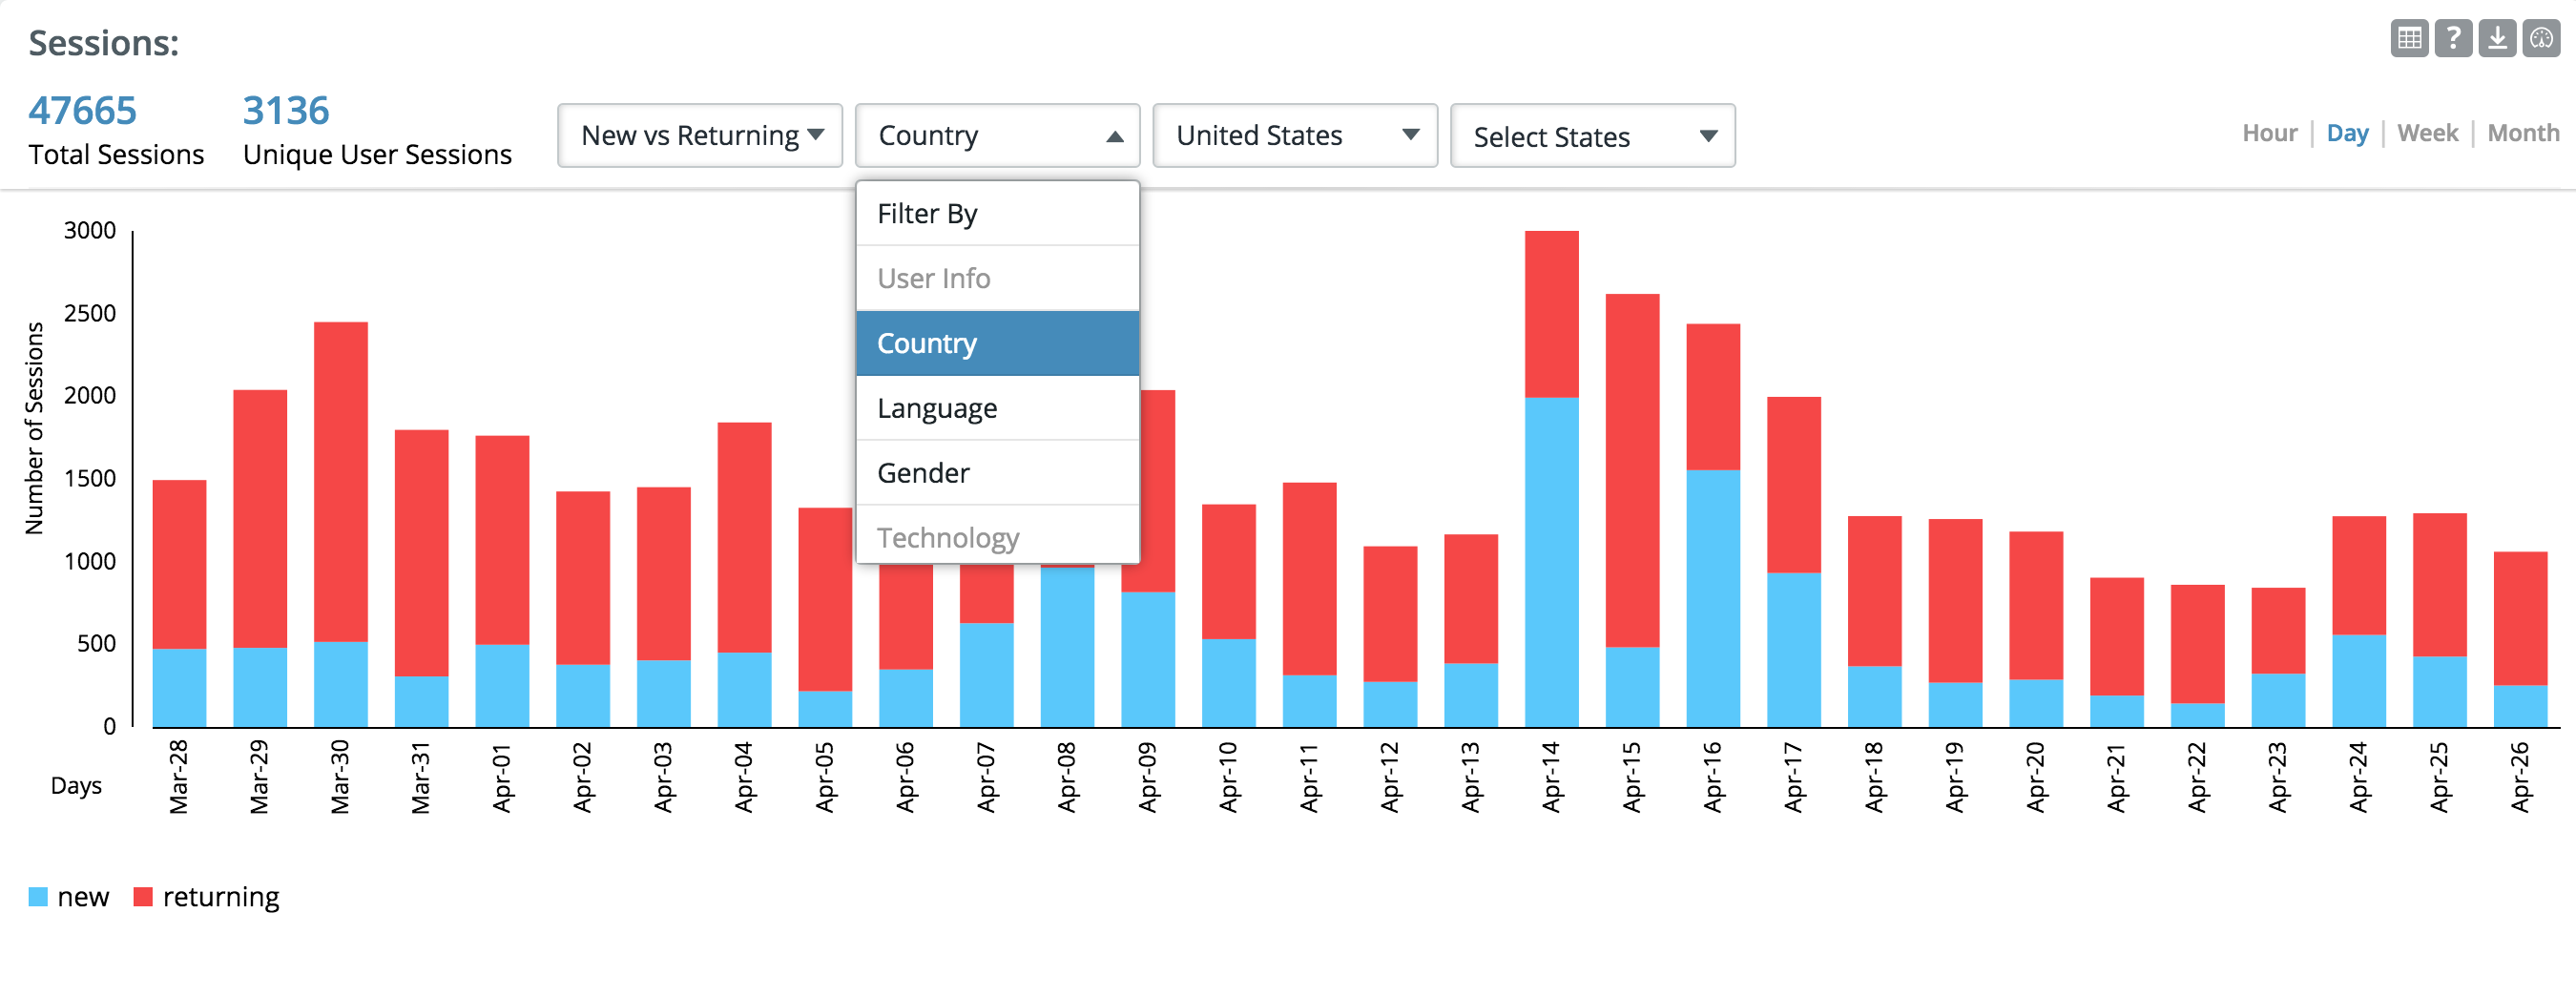
Group By
Group by allows you to view data that can be split by the attribute you choose which are captured by default by Upshot.ai SDK.
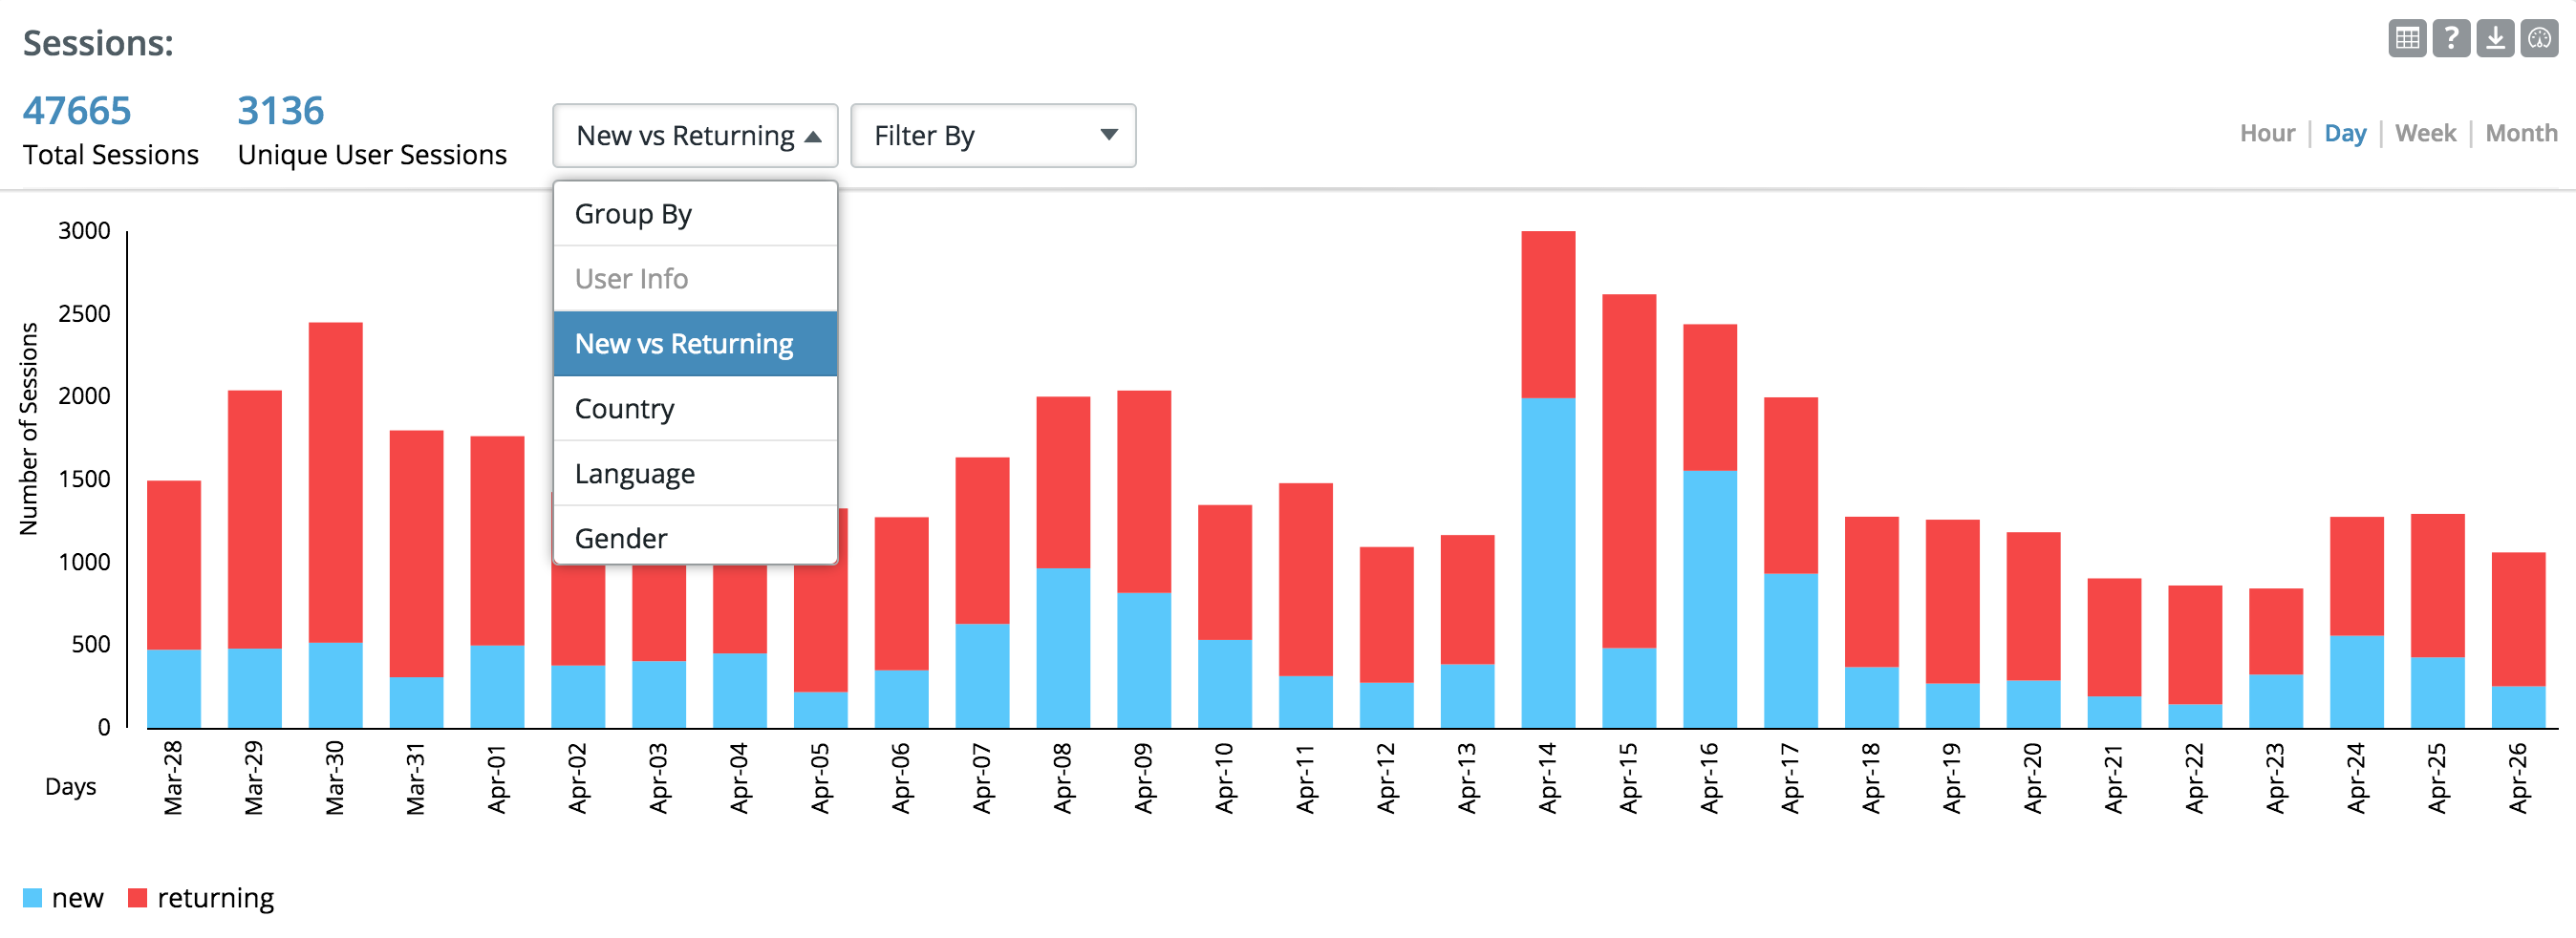
Filter By
You can filter the data displayed by choosing an attribute and then providing a value for the attribute.
For e.g. country = United States, the report will show data of users from United States
Help
The small question “?” mark on top right corner of each report will give you the basic understanding of what the report is about.

Download
You can download the report by clicking on the download icon. Upshot.ai supports data download in csv and excel format.

Add To Dashboard
You can add any report to the dashboard that contains the “Add to dashboard” icon on the top right corner of the report
